Series Tab
On Book Report’s Series Tab you can measure the two core metrics of series performance: read-through and earnings per reader (EPR). Both of these metrics come from one core idea:
Series are usually read from the start and in-order. If we look at our sales data as if both those assumptions are true, we can gain insight into series performance.
Look at your series as a funnel: the most readers are at the start, and the number gets smaller the deeper into a series you get. This is the mental model of the Series Tab.
Video Walkthrough
The video below demonstrates the features of the Series Tab.
The Metrics
For every series, Book Report calculates four metrics which build on each other to give you a full understanding of how a series is performing. Readers and per-unit earnings can be considered the building blocks, whereas read-through and earnings per reader are the headline metrics of series performance.
1. Readers
On the Series Tab, Readers is an estimate of how many people entered the series at your chosen starting point, usually Book #1.
Readers here is not “unique humans with a customer ID,” because Amazon and other book distributors don’t provide that sort of granular data. It’s a practical, consistent way to measure “starts” from the sales/borrows you can observe.
The number of readers you see on the Series Tab will line up with the number of units the starting book has on the Historical tab. It includes sales, borrows (estimated for KU), and giveaways.
2. Per-Unit Earnings
For each book, Book Report computes an average per-unit earnings. This metric is calculated by taking the total earnings for a book, and dividing that number by the total units of the same book.
You can see these values on the Single-Series Deep Dive. Per-unit earnings are the green column:
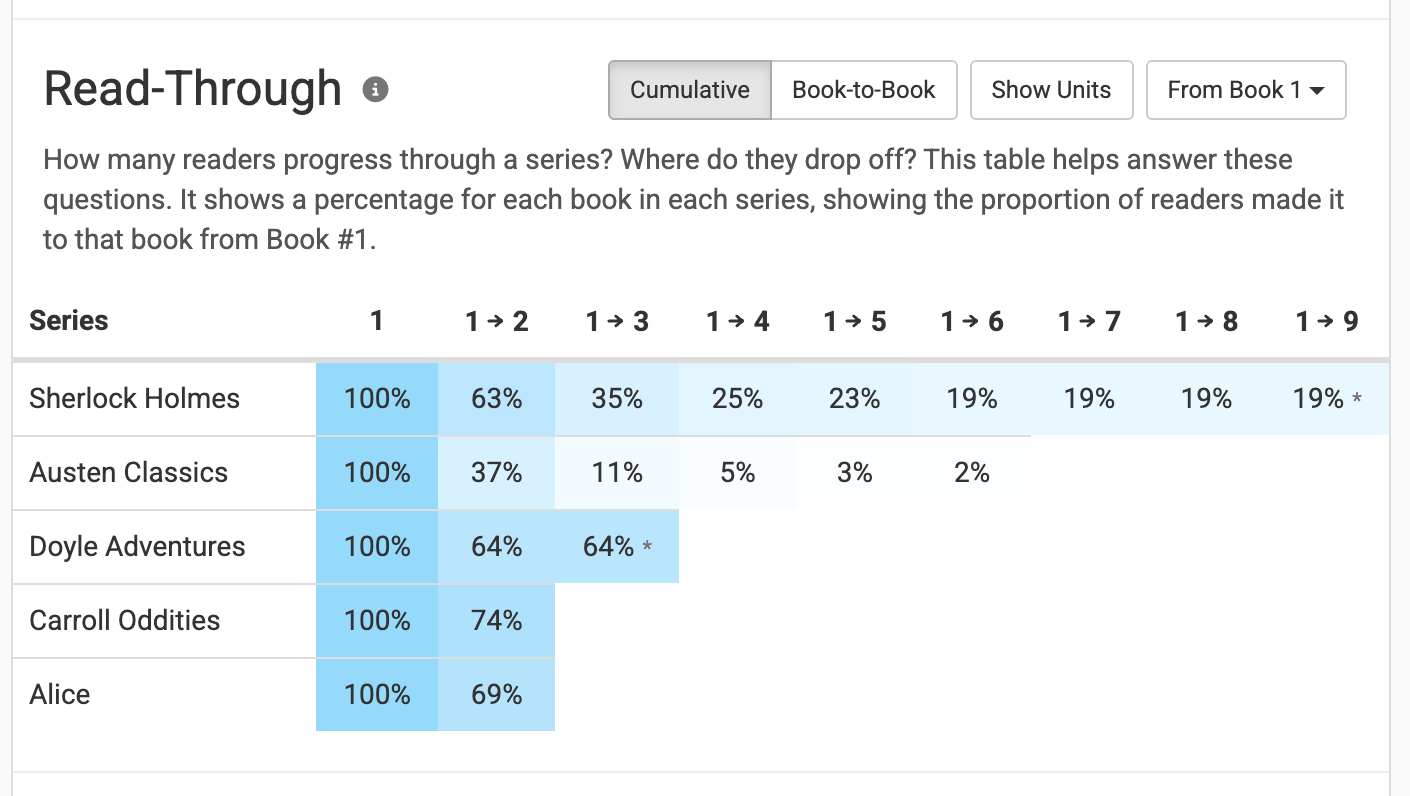
3. Read-Through
How many readers progress through a series? Where do they drop off? These are the questions that read-through answers.
Book Report offers two ways to look at read-through:
- Cumulative shows the percentage of readers who made it to a given book from the start.
- Book-to-book shows the percentage of readers who made it to a given book from the previous book.
Book Report displays read-through in a table like this:
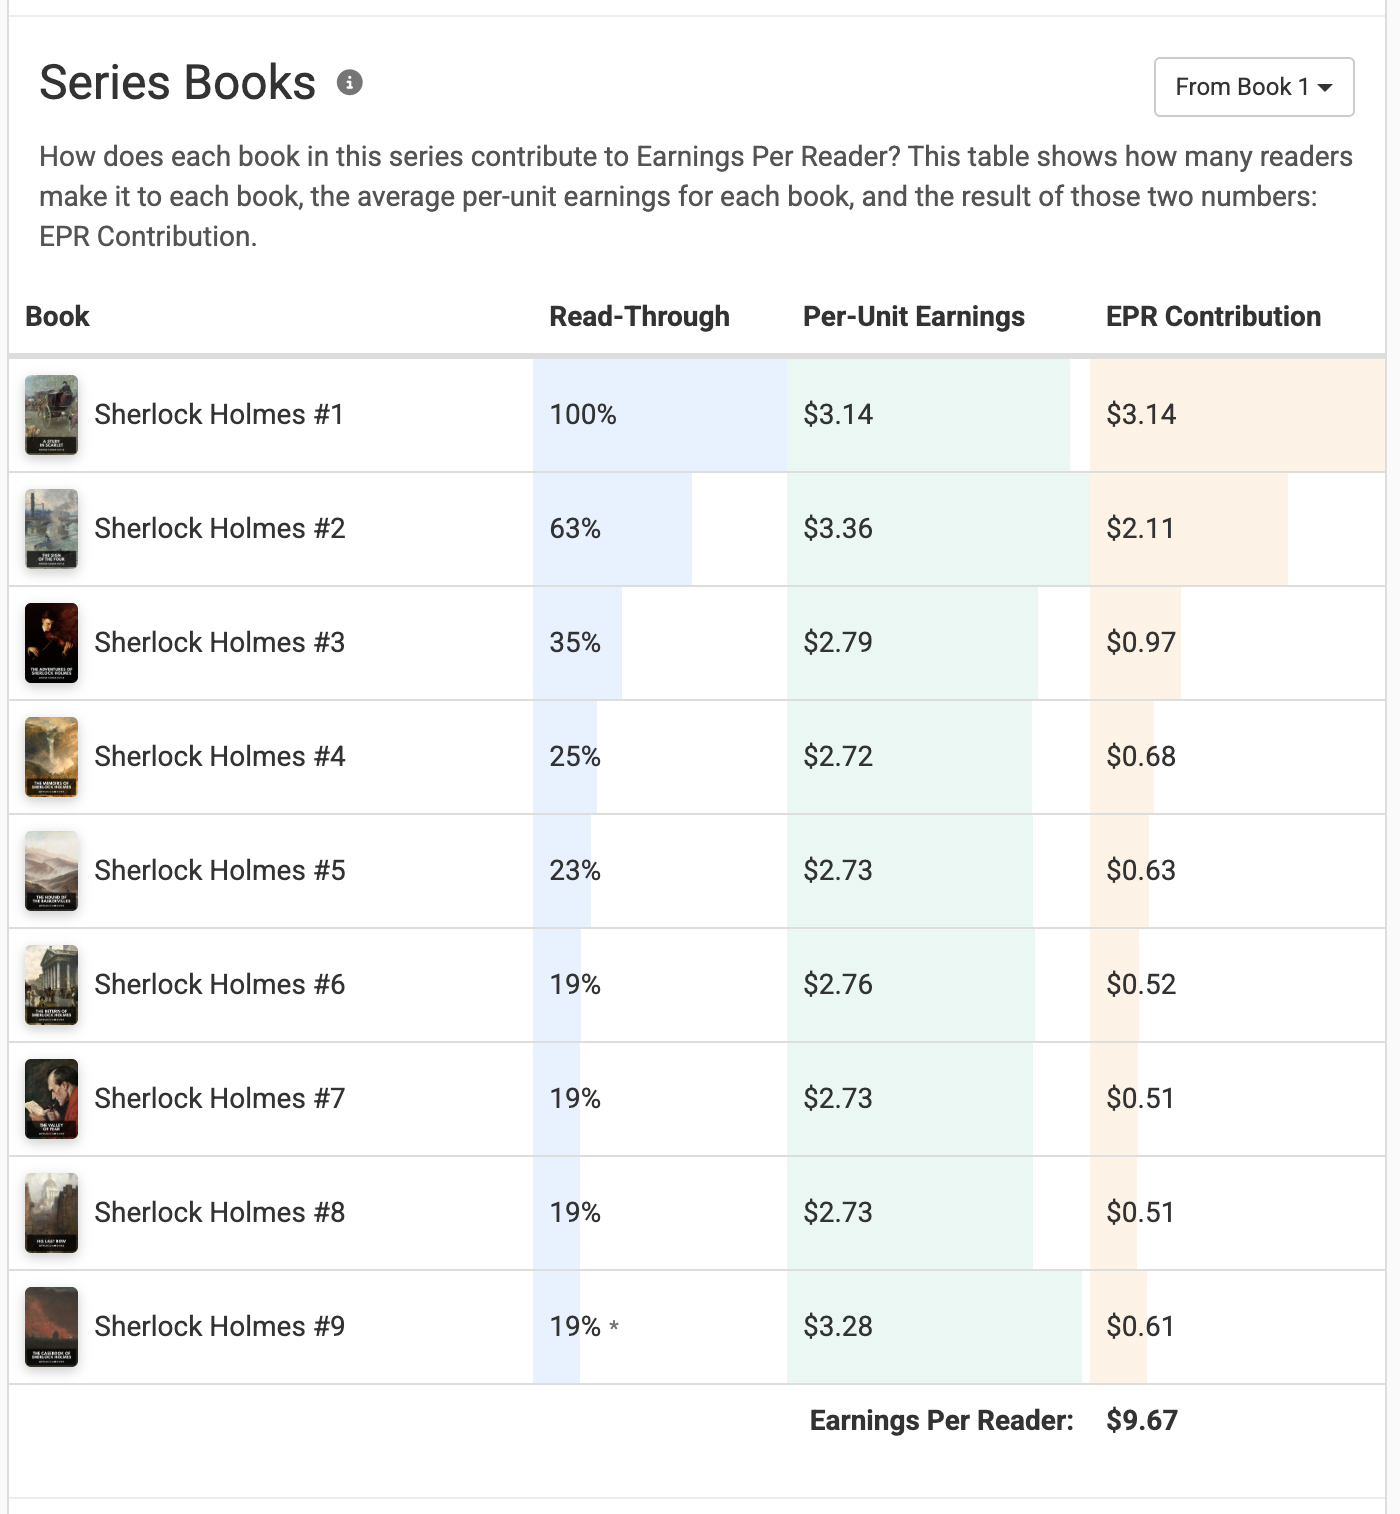
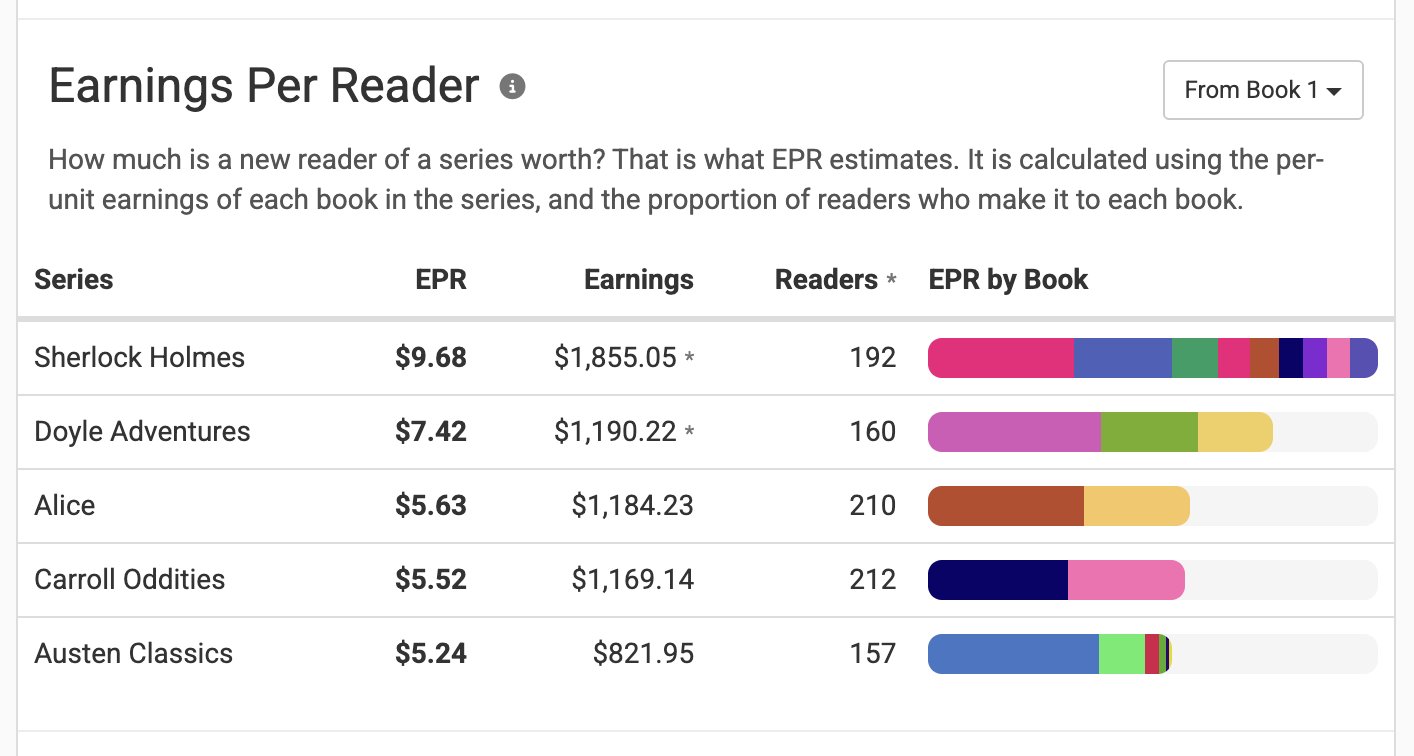
4. Earnings Per Reader (EPR)
How much is a new reader of a series worth? EPR is an estimated answer to that question. Put a bit more technically, it answers the question: “If one new reader starts this series, how much do I earn on average as they move through it?”
It is calculated using the previous two metrics on this list: cumulative read-through and per-unit earnings. For each book in the series we look at:
- What percentage of readers make it to this book from the start?
- What is the average earnings for one unit of this book?
Multiply the percentage by the earnings, repeat for every book in the series, and add them all up to get earnings per reader. Don’t worry: Book Report does all that math for you!
EPR is a very strong signal of overall series performance, and it’s particularly relevant to paid marketing. One way to look at it is: How much can you afford to spend to acquire a new reader? If a reader costs less than EPR to acquire, you’ll likely earn a profit.
Filtering Your Data
If you would like to calculate the above metrics for a subset of your sales data, that can be done with the options at the top of the Series Tab.
This can be useful in several situations:
- Big giveaway promo: free units generally result in lower read-through than paid units. It can be interesting to exclude free units from a report to see how the metrics change.
- Different time-frames: Maybe you spent the last year re-packaging the books in your series. You’d hope to see that read-through and EPR are higher this year than last.
- KU vs Sales: Kindle Unlimited converts at different rates than sales. Maybe you want to see just one or the other.
- Different modeling assumptions: this is the most technical filtering option, explained in detail below.
There are three kinds of filtering you can use on the Series Tab:
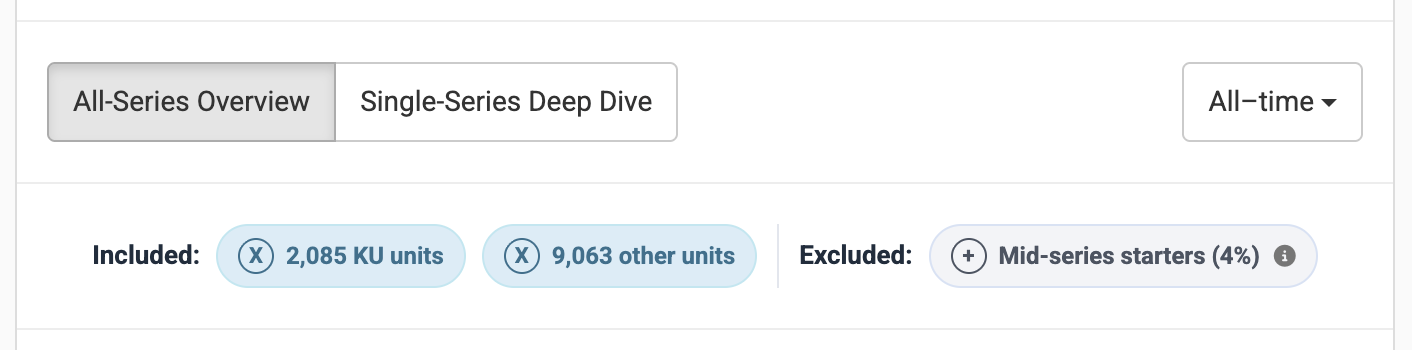
- Date filtering. At the top right of the Series Tab you'll see a button labelled “All-time”. You can click that button to choose any date window you’d like - it includes all the same options as the Historical Tab.
- Unit type filtering. Near the top of the report you will see a list of included and excluded unit types. This will show the number of units categorized as free, KU, and other. You can use the “X” or “+” buttons to include or exclude those units.
- Mid-series starter filtering. Mid-series starters represent the units and earnings that our math suggests did not come from readers who started at Book #1 and proceeded in order. You can include or exclude them from your report as you see fit.
Excluding free units from your series report usually makes all the metrics look better. Read-through is generally lower for giveaways, and EPR increases because you’re removing units but not earnings. But if giveaways are part of your marketing strategy, removing them makes the metrics less useful. Proceed with caution!
Mid-Series Starters
Book Report makes it easy to filter out “mid-series starters”, and does so by default. What are these units, and why do we recommend filtering them out of your reports?
It gets back to the core idea of the Series Tab:
Series are usually read from the start and in-order. If we look at our sales data as if both those assumptions are true, we can gain insight into series performance.
Mid-series starters are the units that break this mental model. Including them can make the numbers counterintuitive.
When you include them:
- Read-through rates can go above 100%. What does a read-through rate of 150% mean? Does it imply that for every two people who read Book #1, one of them recruits a friend to join them reading the series starting at Book #2? Probably not.
- EPR can become unrealistic. Let’s say that most readers, for whatever reason, start a certain series on Book #3. If we don't exclude those readers, it may seem that for every unit of Book #1 that we sell, 10 copies of Book #3 inevitably follow. That will drag up EPR, but make it much less meaningful.
An example: Let's say Book #2 of a series has sold 100 units and Book #3 has sold 150 units. Here’s what happens when we exclude mid-series starters:
- Those 50 “extra” units are removed from Book #3, for the purposes of our calculations.
- Earnings from Book #3 are also reduced proportionally.
- The units and earnings of Book #4 and beyond are also reduced proportionally.
What if a series has multiple entry points?
Some series will naturally have more mid-series starters than others, because some series are written to be read in-order while others offer multiple entry points. If a series has multiple entry points, should you include mid-series starters? You can, but there is a better option.
At the top-right of both the read-through and EPR tables, you will find a button labelled “From Book 1”. You can use that button to recalculate these metrics with a book of your choosing as the starting point. If you’re curious “What is the expected value of a reader who starts at Book #7?”, this is the button to use.
Comparing Across Attributes
There’s one more type of question the Series Tab attempts to answer:
- How does read-through for this series vary by marketplace?
- Is my EPR higher for eBooks or paperbacks?
- How have these metrics changed over the years?
- Do fewer KU readers drop off, compared to book purchasers?
This is what that interface looks like, for read-through (by marketplace in this example):
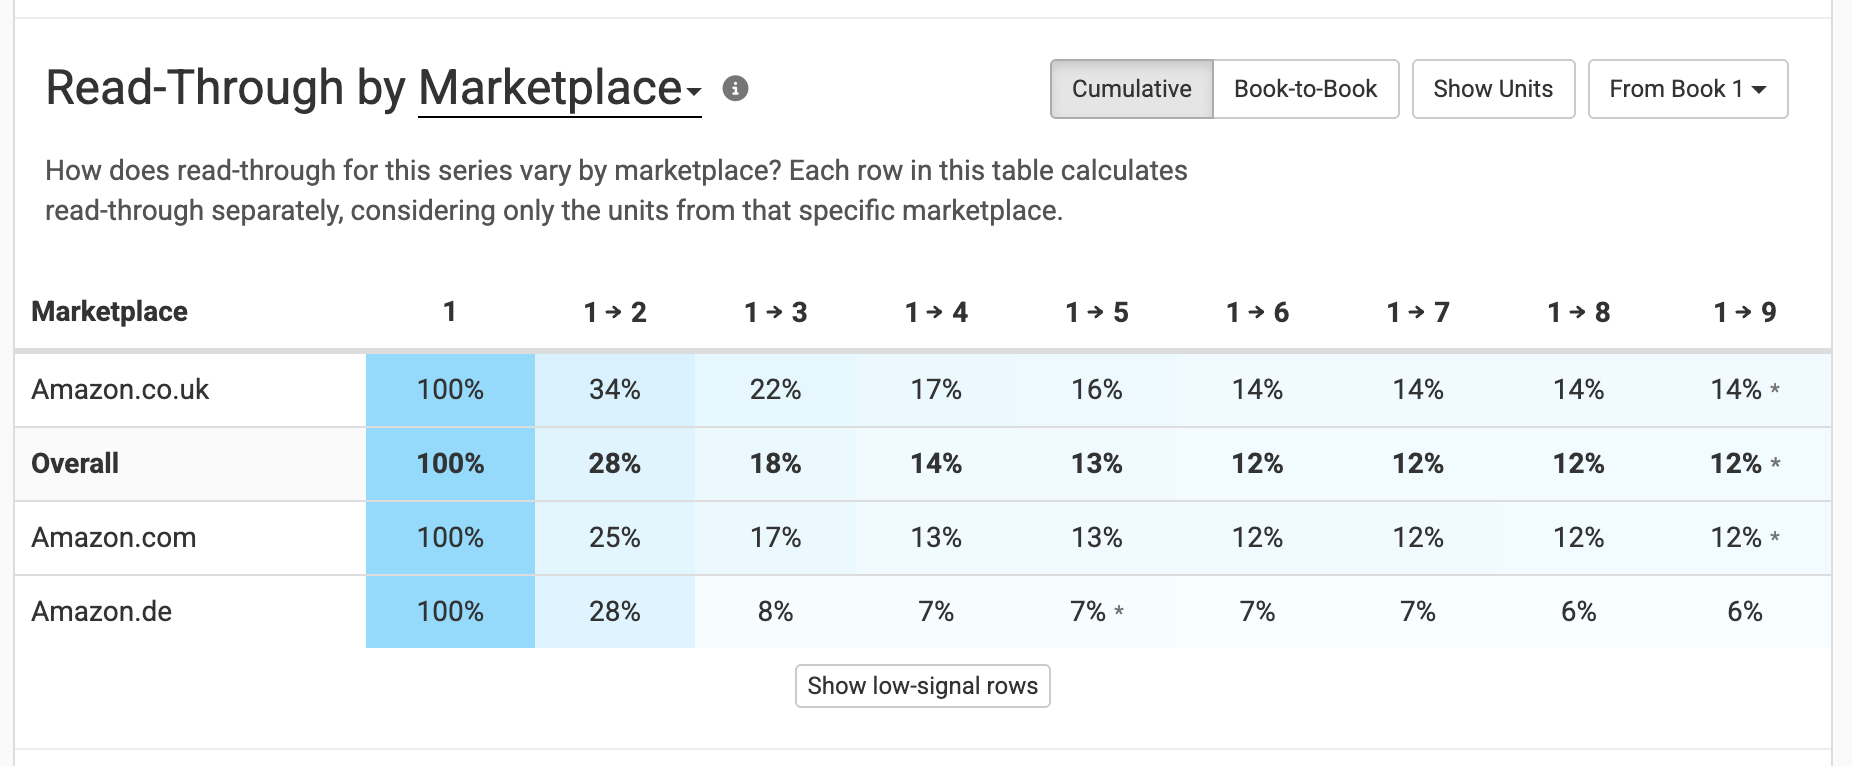
How to make sense of this table?
- Understand that this table only covers a single series. This feature is only available within the Single-Series Deep-Dive.
- Think of each row as a completely separate report. The “Amazon.co.uk” row calculates read-through by only considering units from Amazon.co.uk.
You can click where it says “Marketplace” to switch to a different attribute, which will separate things similarly. Set it to Transaction type to separate sales from KU borrows, or Format to separate eBooks, paperbacks, hardcovers, and audiobooks.
This system also works for EPR, letting you make similar comparisons.
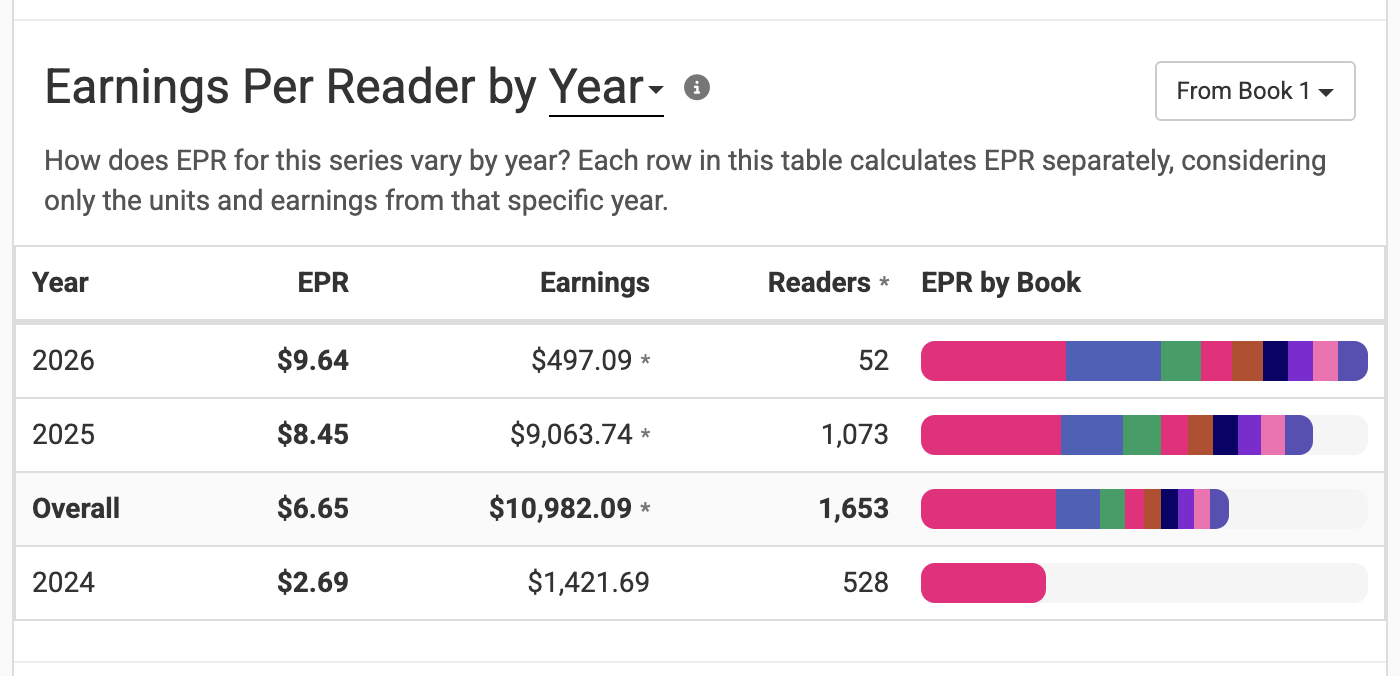
In this example, each row is only considering the units and earnings that occurred within each calendar year. Keep in mind that this is a tool performing simple math - it has no ability to determine, say, whether a sale of Book #2 in 2026 came from someone who bought Book #1 in 2026, 2025, or even 2024.
Known Limitations
There are a few limitations that are worth keeping in mind while interpreting the metrics on the Series Tab. They are:
- Bundles are not accounted for on the Series Tab, which can distort read-through and EPR.
- KU Borrows are estimated, based on the number of page reads and the KENPC of the book.
- Book Report cannot detect free units from certain wide distributors, including Kobo and D2D.